The SMOC Flow Funnel
Before we present the results, let's look at what we are measuring.
A SMOC Flow is an automated and predefined chat flow that is triggered by a user entering a web page, clicking a link from an email/SMS/message service, clicking on an ad or embedded in an ad. The flow has a clear sales and/or engagement objective such as capturing a lead, completing a survey or quiz, referring a new user or onboarding a new customer.
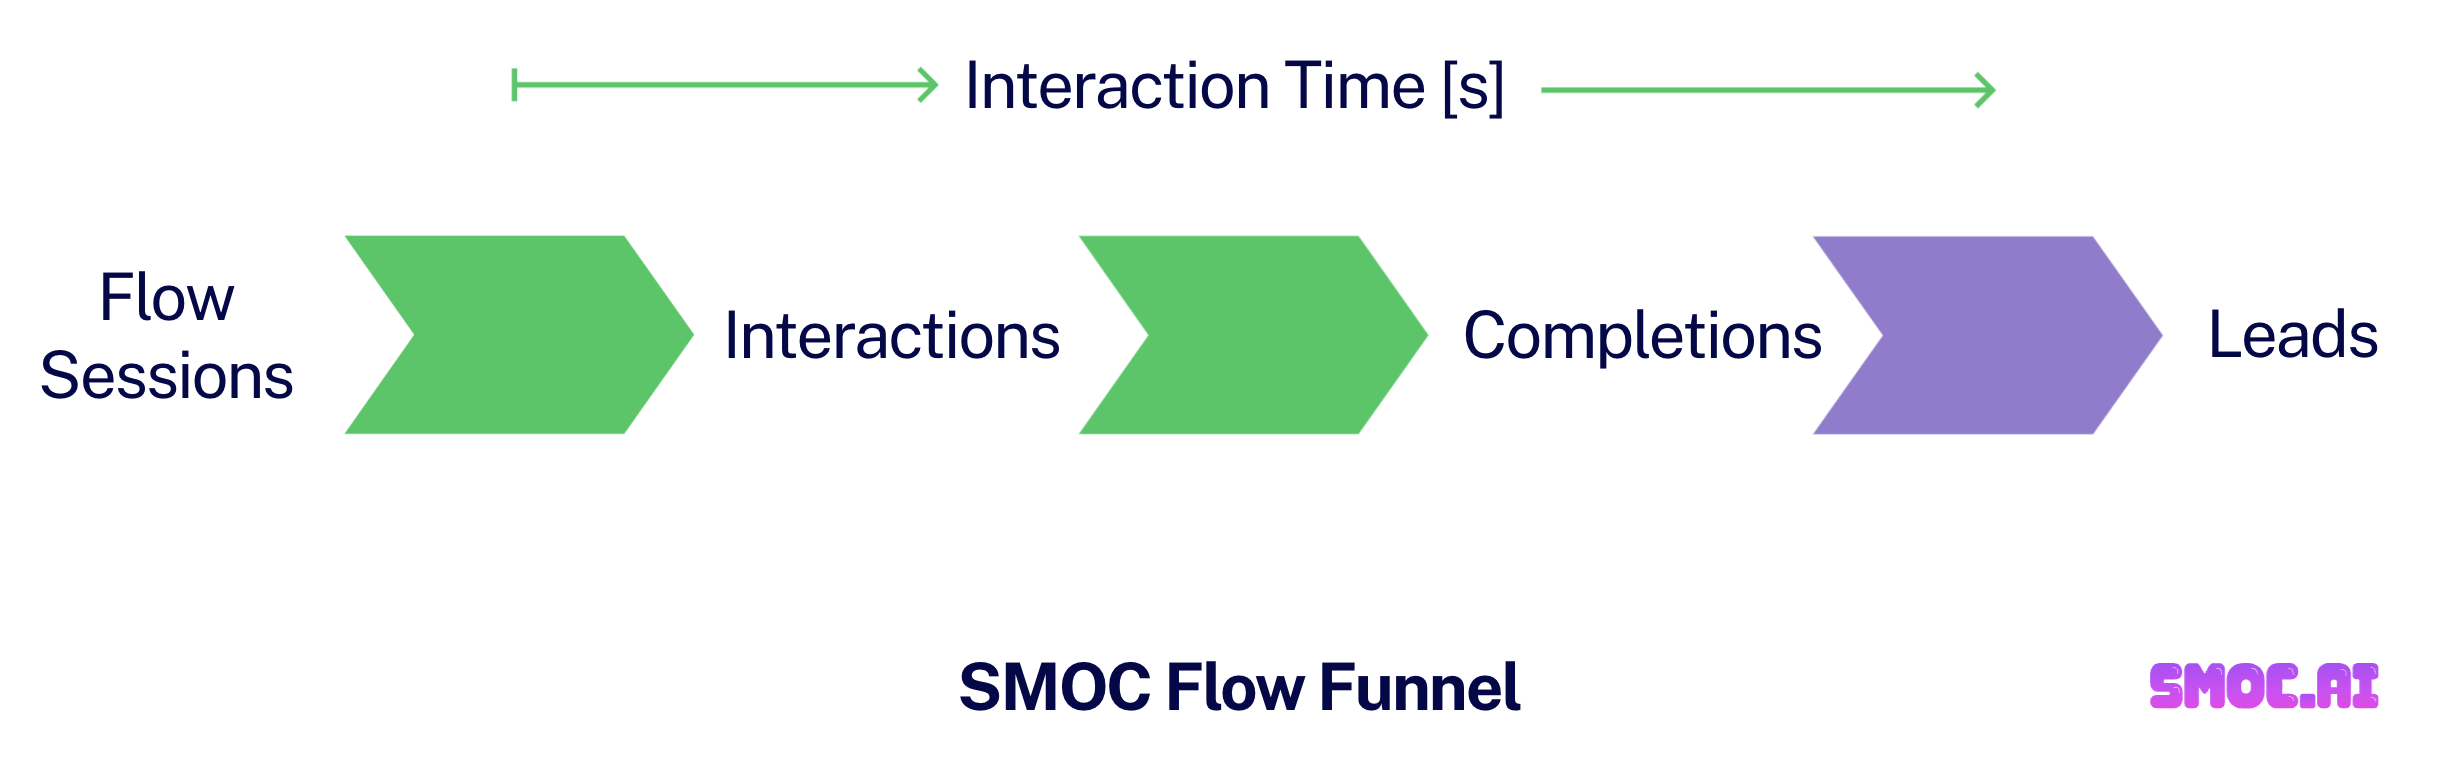
All flow sessions in SMOC start a funnel as depicted below:
Key flow states and KPIs we track are:
| Flow sessions | # of chat flows started. This means that someone has seen the initial messages in any channel. |
| Interactions | # of chat flows where there has been an interaction from the end user (clicked a button, answered a question, watched a video, etc). |
| Completions | # chat flows completed. At this point a user user comes to the final message (in any branch) of a chat flow |
| Leads | # identified contact leads a flow has gathered. Not all flows capture leads |
| KPI | |
| Interaction Time | Average number of seconds of flows with interactions A high number means that the brand engagement strong from the flow. |
| Interaction rate | Interactions / Flow Sessions A high number means that the flow is well aligned with the expectations set from the start of the flow. |
| Completion rate | Completions / Interactions A high number means that customers are kept engaged during the chat flow. |
| Lead rate | Leads / Completions A high number means that customer is incentivised to leave their contact info. |
Now, let's have a look at the 2022 performance
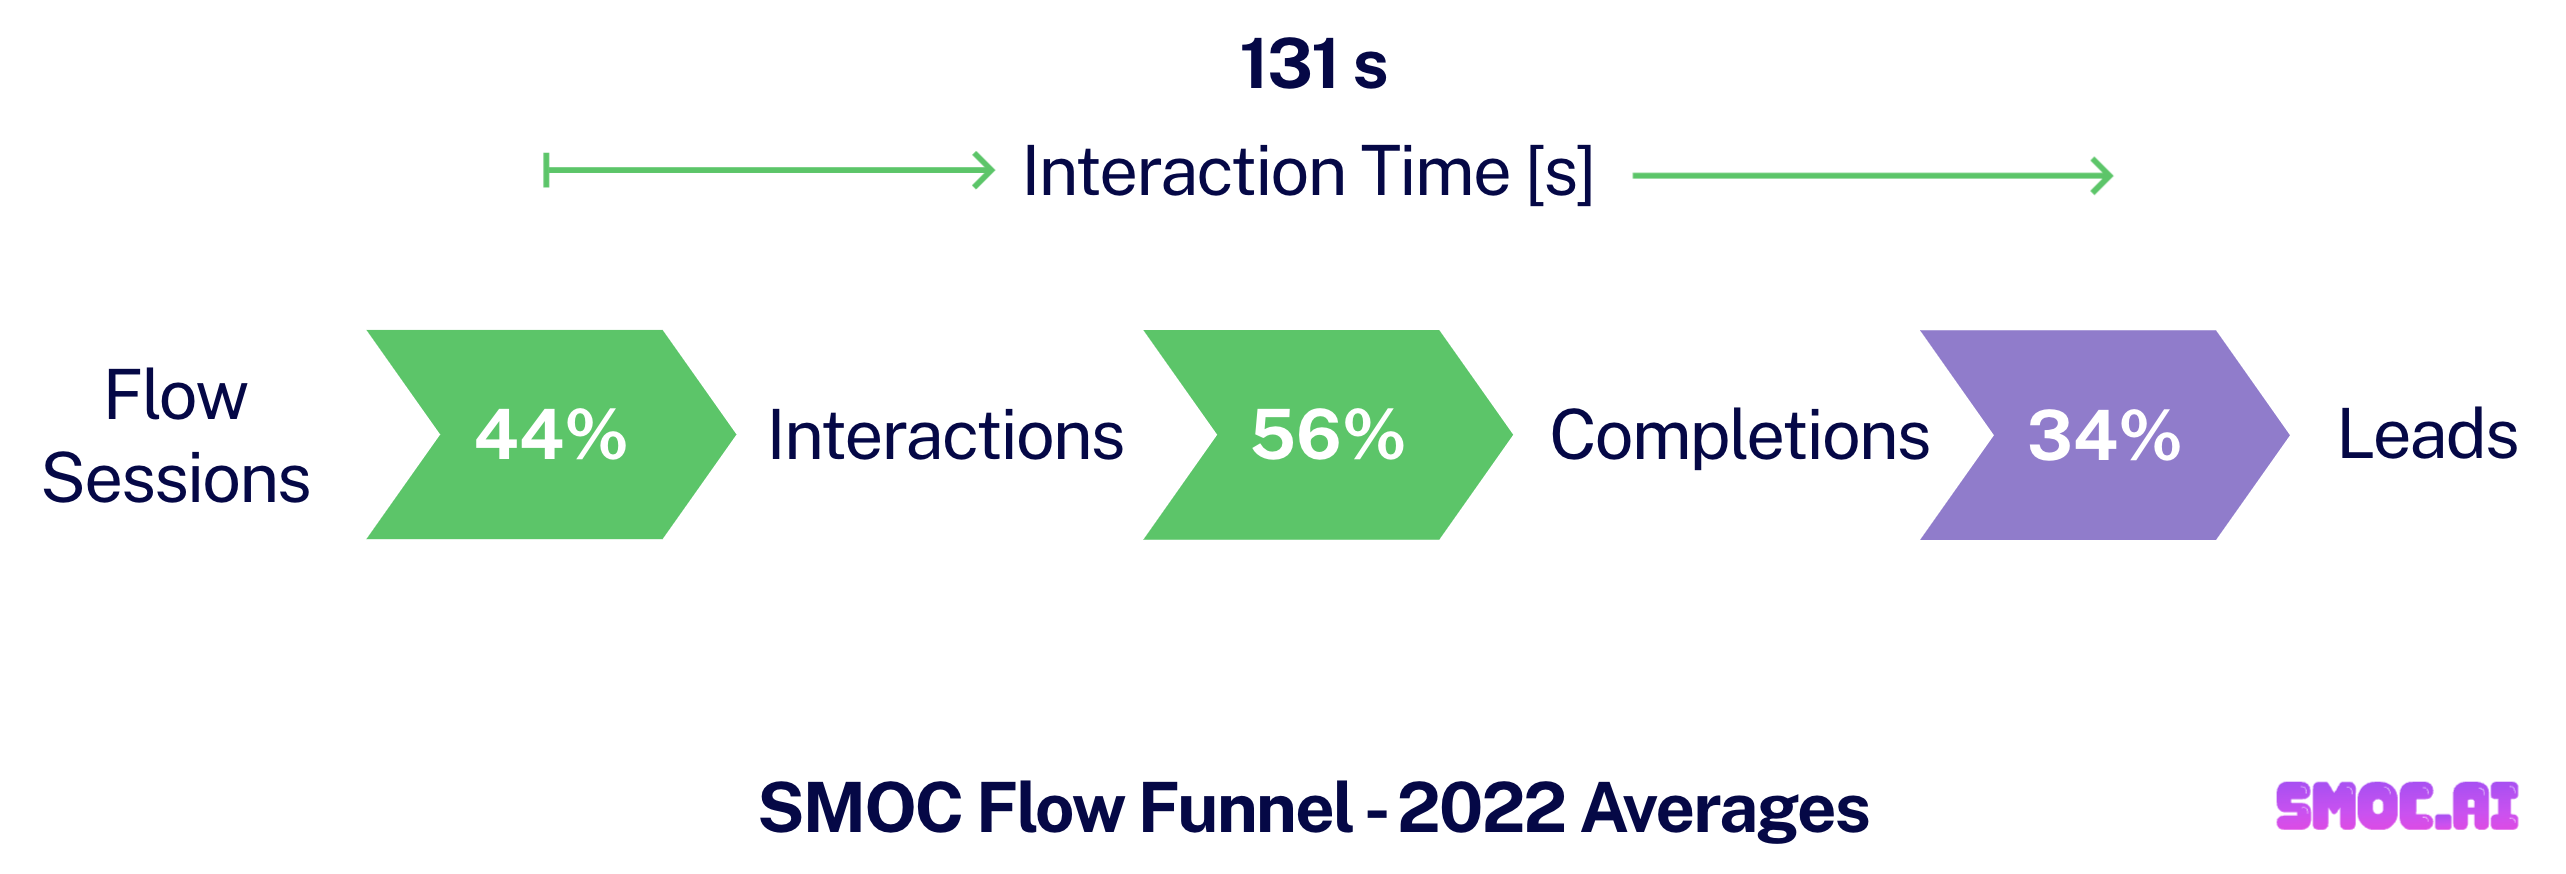
Flow Funnel 2022 Averages
Every client of SMOC has on average had 5 flows live. The average performance indicators for these flows are as depicted and explained in the following diagram and table.
Not all flows capture leads, so only flows capturing leads have been added to the completed to the lead rate.
A few comments about the key performance indicators.
| KPI | Value | Comments on Performance |
| Interaction Time | 131s | According to Research by Amplified Intelligence, "Memory retention doesn’t kick in until an ad is seen for about 3 seconds, after which on average every active attention second leads to an average 3 days in memory ". You can imagine what 131 seconds means. Next time an end customer things about a problem (s)he needs solved, you brand will be in memory. |
| Interaction rate | 44% | That almost half of end users interact and that they spend on average over two minutes leaving data and engaging in with the brand shows the power of the conversational format. This is in line with research by Shoppop showing that conversational landing pages yield 3-4x higher engagement than traditional landing pages. |
| Completion rate | 56% | Of these interactions. Over half finish a conversational flow. |
| Lead rate | 34% | For lead capturing cases. Over 1/3 of flows that finish leave their contact details as a lead. Of all sessions 1/10 leave their contact details in SMOC flows targeted at that. This is stellar when you compare to a classic landing page conversion according to Wordpress that generates typically 1/50. This is a 5x performance improvement to the average. |
10-20x Performance improvement possible?
So we have here shared that on average you get a 5x improvement. However when combining with rewards and the special conversational formats some of our best clients get even better values.
As shared before we are a strong advocate for the SMOC 10x formula that shows how you can reach at least 10x business impact using the core platform elements of SMOC: Conversations x Rewards x AI. On certain use cases we in fact seeing 20x compared to typical performance. How is that even possible you might ask? Let's have a look at some email campaigns triggering a basket of a few great performing SMOC flows in 2022.
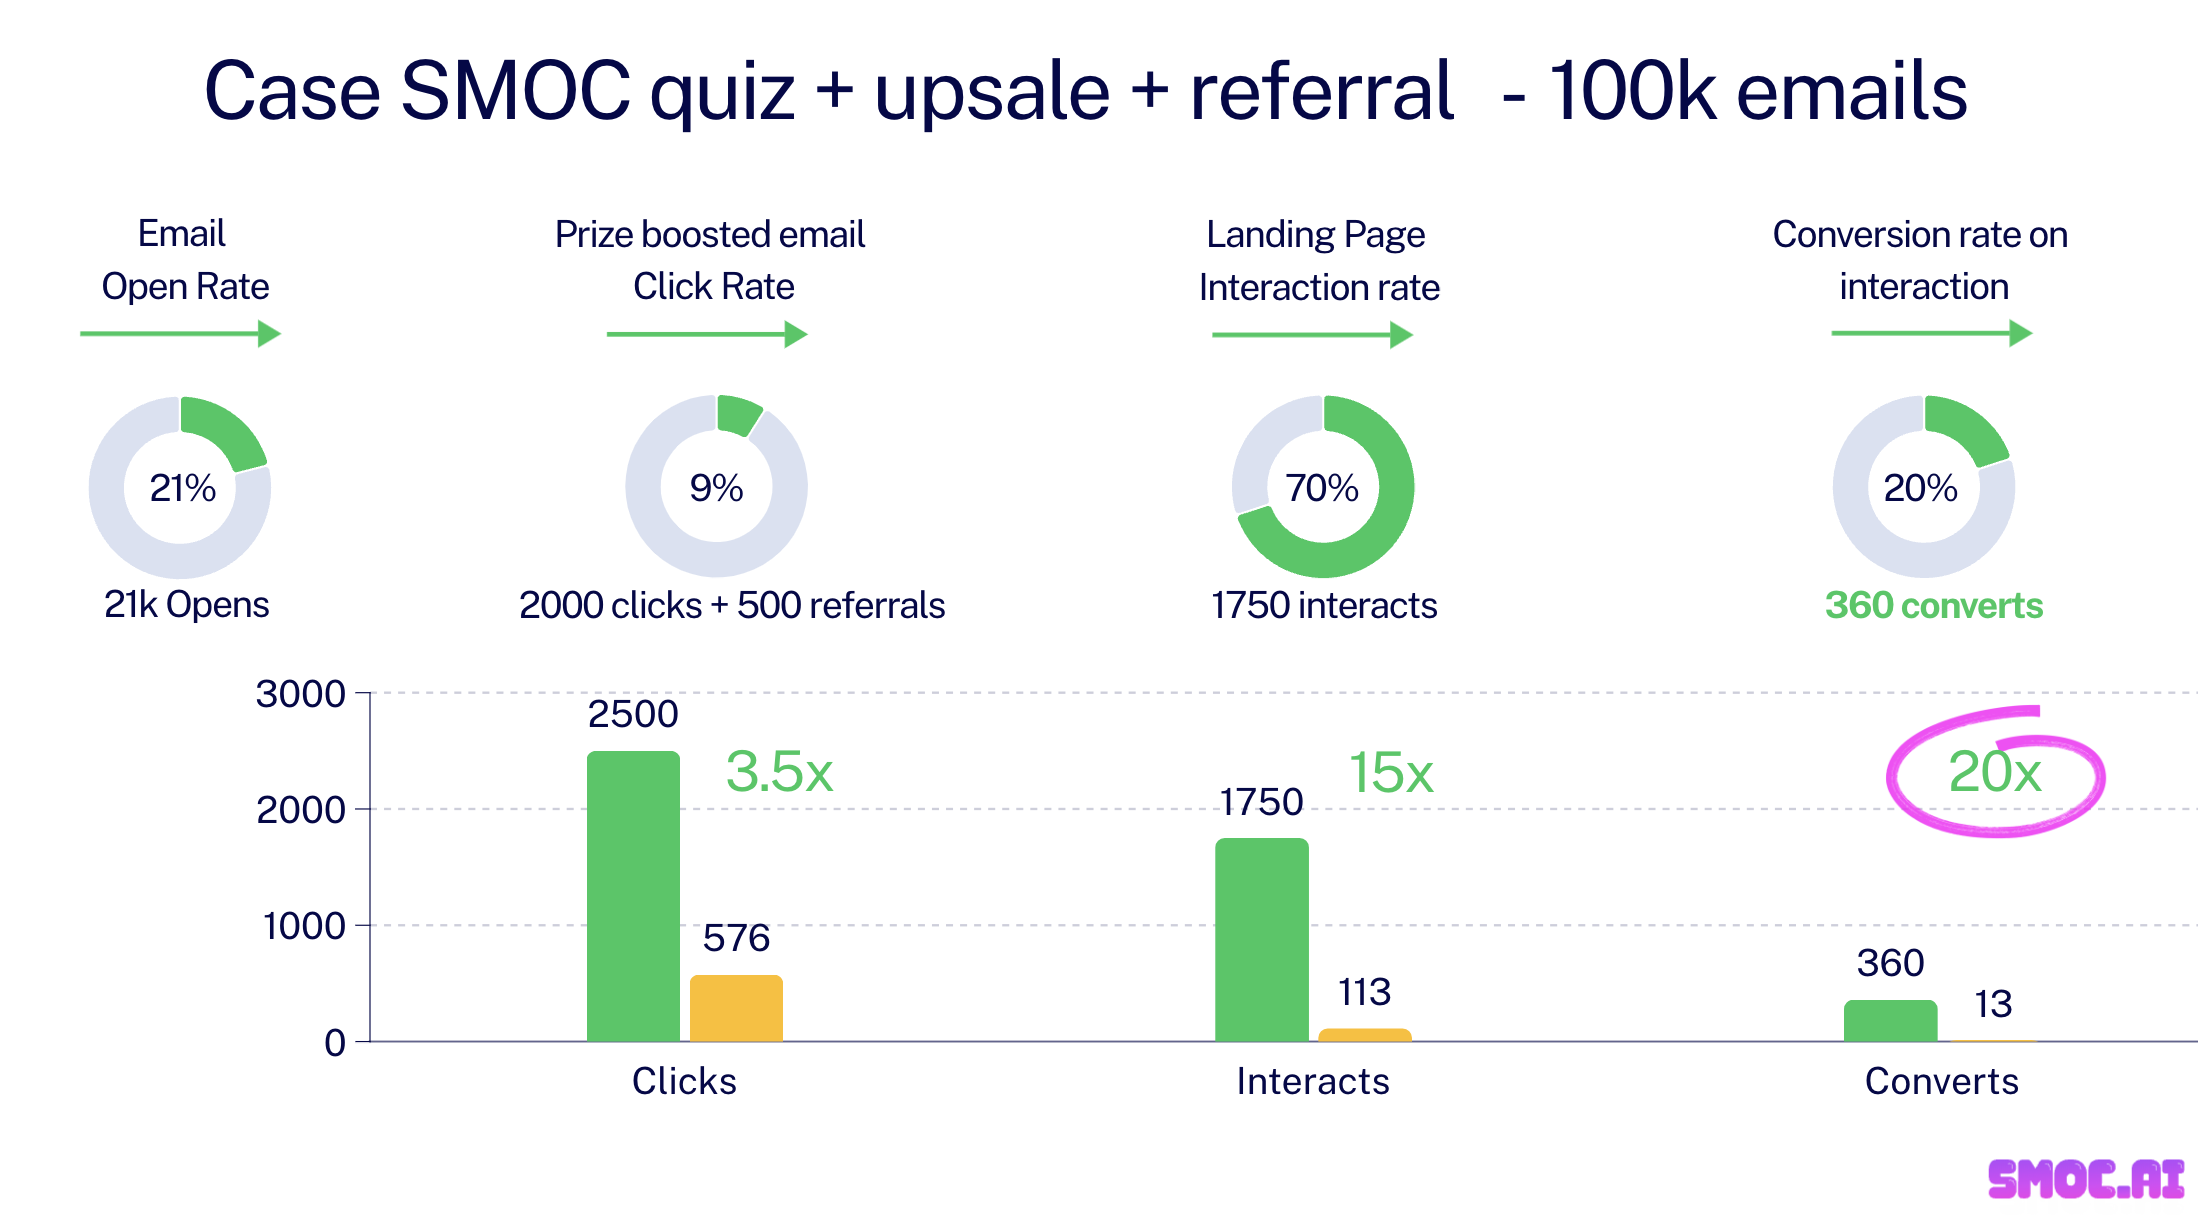
The performance below is based on standard benchmarks from Mailchimp(*), Hubspot(**) and Wordstream(***). From 100k emails sent to your clients you will on average in the end have 13 end conversions.
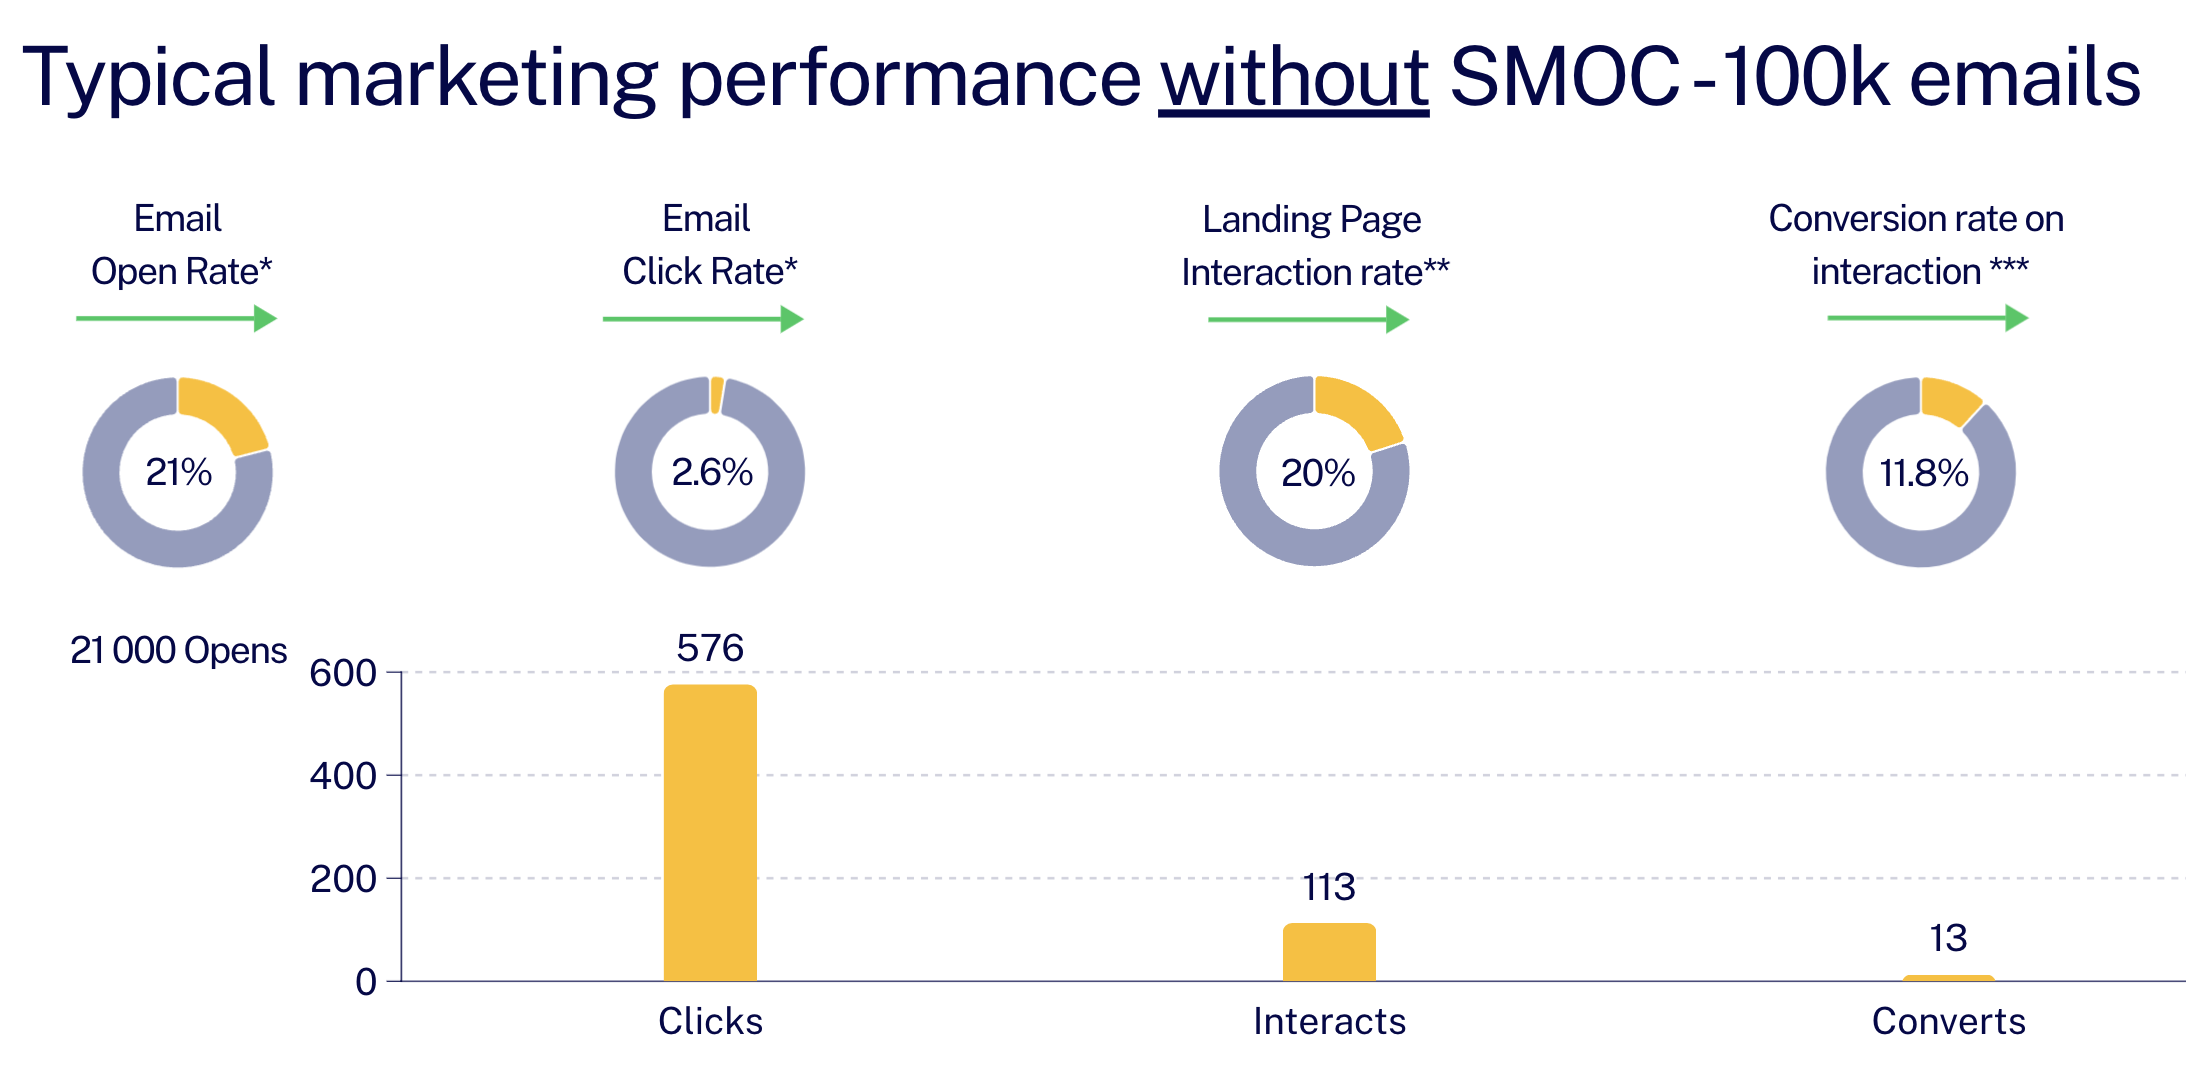
Now look at the average performance we have on a SMOC campaign yielding 20x. Your 100k emails ends up with 360 conversions!
Wonder how this is done? Don't hesitate to reach out or follow our newsletter to stay informed.


